Back to The Library
Class Survey Live: Our Data
Created by Argraide
Updated October 27th, 2026
At a glance
- Staff pick
- Picked by the Argraide team
- Play mode
- 👥 Group
- Format
- 🖼️ 2D
- Length
- ⏱ About 20 minutes
- Subject
- Math
- Grade
- 5
- Curriculum
- Ontario
- Curriculum codes
- D1.2D1.3D1.5D1.6
About this activity
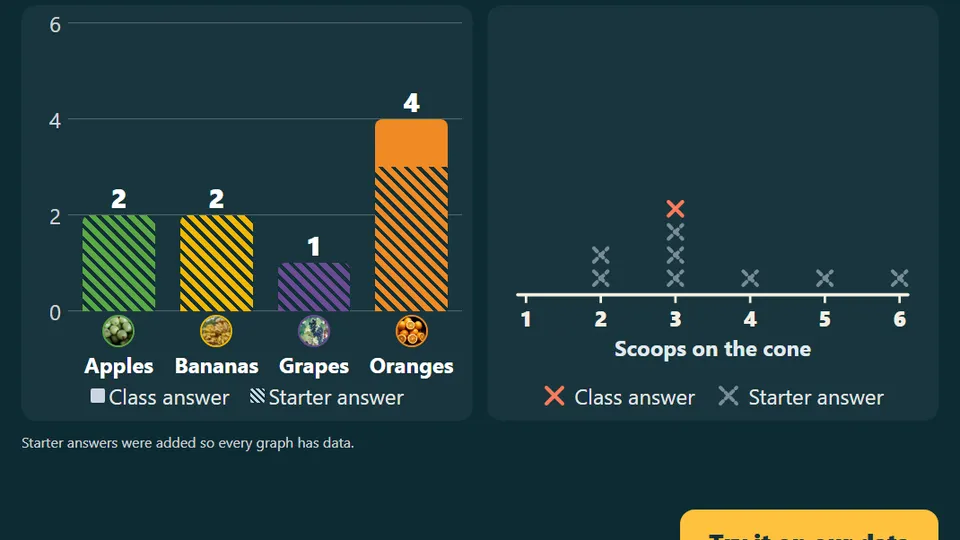
A live warm-up poll and word cloud whose answers become the class's own data. The big screen turns them into a bar graph and a line plot, and every phone works out the mode, median, range and mean of that data.
What students learn
- Collect survey data, organize it in frequency and relative-frequency tables (counts as fractions of all the votes), and display it in a bar graph and a line plot (D1.2, D1.3)
- Choose a suitable graph for categories and for numbers on a number line (D1.3)
- Find and interpret the mode, median, range and mean of our own poll data (D1.5)
Reviews
No reviews yet. Be the first to review this activity!
Sign in to review